用 D3.js 画一个手机专利关系图, 看看苹果,三星,微软间的专利纠葛
# 用 D3.js 画一个手机专利关系图, 看看苹果,三星,微软间的专利纠葛
# 前言
本文灵感来源于Mike Bostock 的一个 demo 页面
原 demo 基于 D3.js v3 开发, 笔者将其使用 D3.js v5 进行重写, 并改为使用 ES6 语法.
源码: github
在线演示 : demo
# 效果

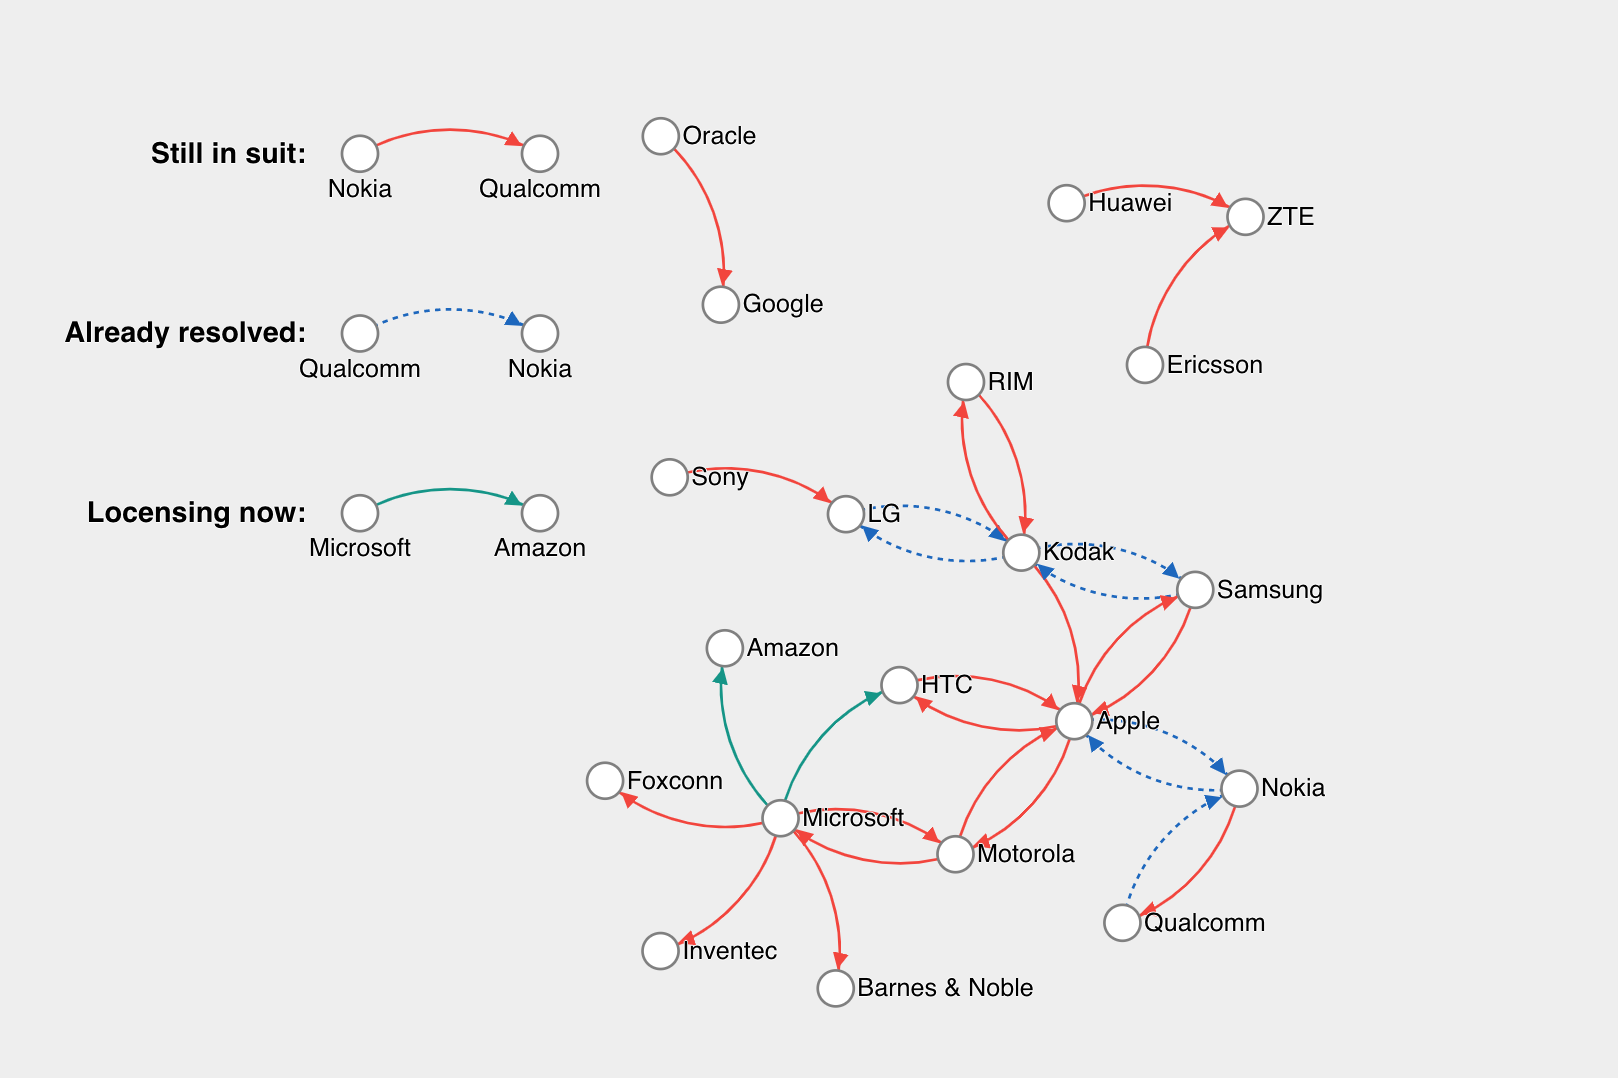
可以看到, 上图左上角为图例, 中间为各个手机公司之间的专利关系图.
图例中有三种线段:
- 红色实线: 正在进行专利诉讼 (箭头指向方为被诉讼方)
- 蓝色虚线: 诉讼已经结束
- 绿色实线: 专利已经授权
# 实现
下面让我们看看如何一步步实现上图的效果.
# 分析数据
[
  { source: 'Microsoft', target: 'Amazon', type: 'licensing' },
  { source: 'Microsoft', target: 'HTC', type: 'licensing' },
  { source: 'Samsung', target: 'Apple', type: 'suit' },
  { source: 'Motorola', target: 'Apple', type: 'suit' },
  { source: 'Nokia', target: 'Apple', type: 'resolved' },
  { source: 'HTC', target: 'Apple', type: 'suit' },
  { source: 'Kodak', target: 'Apple', type: 'suit' },
  { source: 'Microsoft', target: 'Barnes & Noble', type: 'suit' },
  { source: 'Microsoft', target: 'Foxconn', type: 'suit' },
  ...
]
2
3
4
5
6
7
8
9
10
11
12
可以看到, 每一条数据都是由以下几部分组成:
source: 诉讼方的公司名称target: 被诉讼方的公司名称type: 当前诉讼状态
需要注意的是: 有一些公司 (如 Apple, Microsoft ) 同时参与了多起诉讼案件, 但我们在数据可视化时只会为每一个公司分配一个节点, 然后用连线表示各个公司之间的关系.
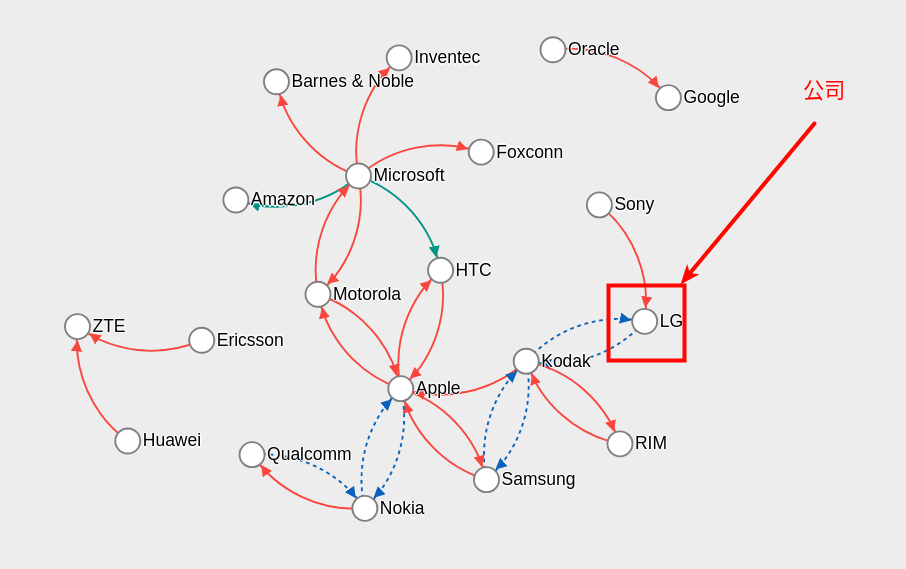
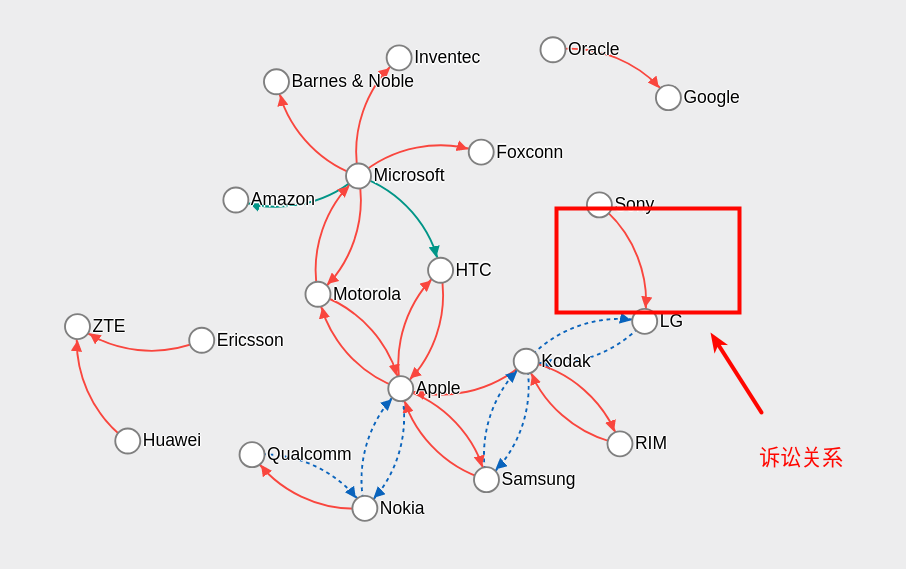
数据可视化最重要的就是数据和图像之间的映射关系, 本例中我们的可视化的逻辑为:
- 将每一个公司作为图中的一个圆形节点
- 将每一条诉讼关系表示为两个圆形节点之间的连线
公司 ==> 圆形节点
诉讼关系 ==> 连线
# 技术分析
要实现可以拖动, 自动布局的网络图, 本 demo 用到了 D3.js 中的 d3-force 和 d3-drag , 当然还有最基础的 d3-selection.
(为了方便搭建用户界面, 使用了 Vue 作为前端框架. 但 Vue 并不对数据可视化逻辑产生影响, 不使用也不会对我们的实现造成影响.)
# 代码实现
现在让我们进入代码部分, 首先我们画出每个公司代表的圆形节点:
上面说到了, 原始数据中, 有部分公司多次出现在不同的诉讼关系中, 而我们要为每个公司画出唯一的节点, 所以我们要对数据进行一些处理:
  initData() {
    this.links = [
      { source: 'Microsoft', target: 'Amazon', type: 'licensing' },
      { source: 'Microsoft', target: 'HTC', type: 'licensing' },
      { source: 'Samsung', target: 'Apple', type: 'suit' },
      { source: 'Motorola', target: 'Apple', type: 'suit' },
      { source: 'Nokia', target: 'Apple', type: 'resolved' },
      ...
    ] // 这里省略了一些数据

    this.nodes = {}

    // Compute the distinct nodes from the links.
    this.links.forEach(link => {
      link.source =
        this.nodes[link.source] ||
        (this.nodes[link.source] = { name: link.source })
      link.target =
        this.nodes[link.target] ||
        (this.nodes[link.target] = { name: link.target })
    })
    console.log(this.links)
  }
2
3
4
5
6
7
8
9
10
11
12
13
14
15
16
17
18
19
20
21
22
23
上面这段代码的逻辑是, 遍历所有的 links, 将其中的 source 和 target 作为 key 放置到 nodes 中, 这样我们就得到了不含重复节点的数据 nodes:
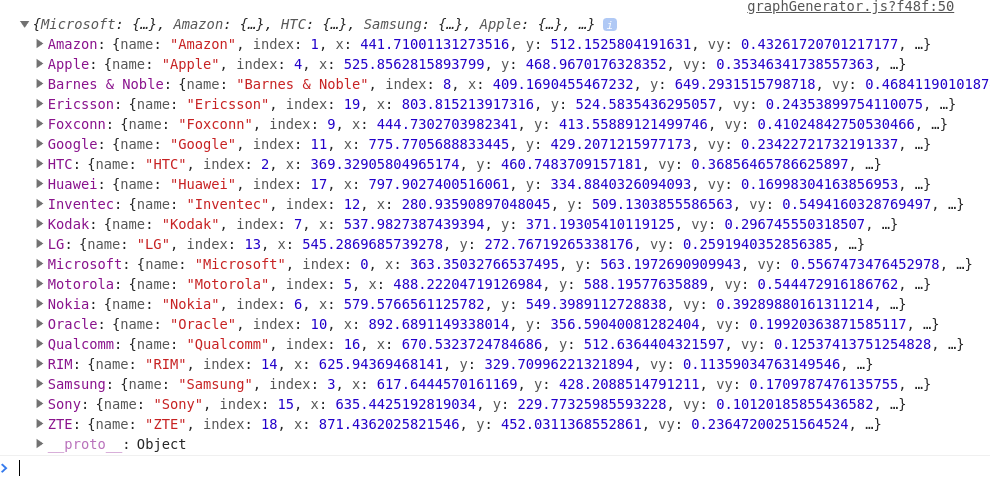
细心的读者可能已经发现了, 上面的数据中有许多 x, y 的坐标数据, 这些数据是从哪里来的呢? 答案就是 d3-force, 因为我们要实现的是模拟物理作用力的分布图, 所以我们使用了 d3-force 来模拟并帮助我们计算出每个节点的位置, 调用方法如下:
this.force = this.d3
  .forceSimulation(this.d3.values(this.nodes))
  .force('charge', this.d3.forceManyBody().strength(50))
  .force('collide', this.d3.forceCollide().radius(50))
  .force('link', forceLink)
  .force(
    'center',
    this.d3
      .forceCenter()
      .x(width / 2)
      .y(height / 2)
  )
  .on('tick', () => {
    if (this.path) {
      this.path.attr('d', this.linkArc)
      this.circle.attr('transform', transform)
      this.text.attr('transform', transform)
    }
  })
2
3
4
5
6
7
8
9
10
11
12
13
14
15
16
17
18
19
这里我们为 d3-force 添加了三种作用力:
.force('charge', this.d3.forceManyBody().strength(50))为每个节点添加互相之间的吸引力.force('collide', this.d3.forceCollide().radius(50))为每个节点添加刚体碰撞效果.force('link', forceLink)添加节点之间的连接力
执行上面的代码后, d3-force 就会为每一个节点计算好坐标并将其 作为 x, y 属性赋予每个节点.
# 画出代表公司的 圆形节点
处理好了数据, 让我们将其映射到页面上的 svg ==> circle 元素:
this.circle = this.svgNode // svgNode 为页面中的 svg节点 (d3.select('svg'))
  .append('g')
  .selectAll('circle')
  .data(this.d3.values(this.nodes)) // d3.values() 将对象数据 Object{}转换为数组数据 Array[]
  .enter()
  .append('circle')
  .attr('r', 10)
  .style('cursor', 'pointer')
  .call(this.enableDragFunc())
2
3
4
5
6
7
8
9
注意到这里我们在最后调用了 .call(this.enableDragFunc()) , 这点代码是为了实现 circle 节点的拖拽功能, 我们在后面再进一步讲解.
上面这段代码逻辑为: 将 nodes 数据映射为 circle 元素, 并设置 circle 元素的属性:
- 半径 10
- 鼠标悬停图标为手指
- 将每个 node 的 x, y 属性赋予 circle 的 x, y (˙ 这一步我们在代码中没有声明, 是因为 d3 默认会将数据的 x, y 属性作为 circle 的 x, y 属性)
执行以上代码后的效果:

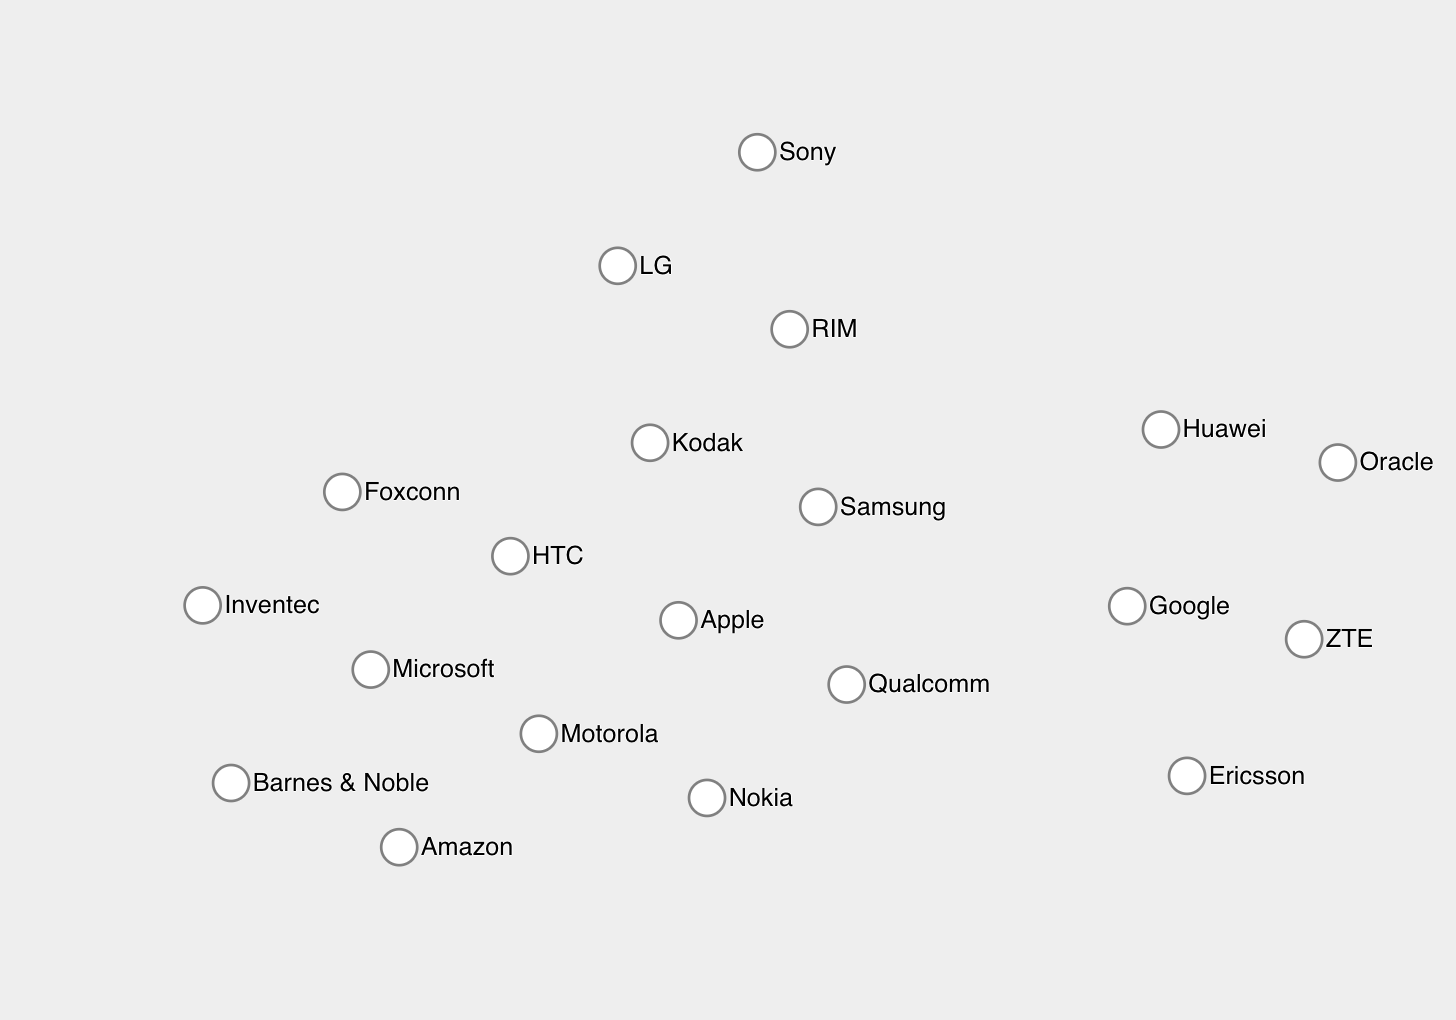
# 画出公司名称
画出代表公司的圆形节点后, 再画出公司名称就很简单了. 只需要将 x, y 坐标进行一定偏移即可.
这里我们将公司名称放在圆形节点的右方:
this.text = this.svgNode
  .append('g')
  .selectAll('text')
  .data(this.d3.values(this.nodes))
  .enter()
  .append('text')
  .attr('x', 12)
  .attr('y', '.31em')
  .text(d => d.name)
2
3
4
5
6
7
8
9
上面的代码只是将 text 元素放置在了 (12 , 0 ) 的位置, 我们在 d3-force 的每一个 tick 周期中, 对其 text 进行位置的偏移, 这样就达到了 text 元素在 circle 元素右侧 12 个像素的效果:
this.force = this.d3
      ...
      .on('tick', () => {
        if (this.path) {
          this.path.attr('d', this.linkArc)
          this.circle.attr('transform', transform)
          this.text.attr('transform', transform)
        }
      })
2
3
4
5
6
7
8
9
效果如图:
# 画出诉讼关系连线
接下来我们将有诉讼关系的节点连接起来. 因为连线不是规则的图形, 所以我们使用 svg 的 path 元素来实现.
this.path = this.svgNode
  .append('g')
  .selectAll('path')
  .data(this.links)
  .enter()
  .append('path')
  .attr('class', function(d) {
    return 'link ' + d.type
  })
  .attr('marker-end', function(d) {
    return 'url(#' + d.type + ')'
  })
2
3
4
5
6
7
8
9
10
11
12
我们使用 'link ' + d.type 为不同的诉讼关系连线赋予不同的 class, 然后通过 css 对不同 class 的连线添加不同的样式(红色实线, 蓝色虚线, 绿色实线).
path 的 d 属性我们同样在 d3-force 的 tick 周期中设置:
this.force = this.d3
      ...
      .on('tick', () => {
        if (this.path) {
          this.path.attr('d', this.linkArc)
          this.circle.attr('transform', transform)
          this.text.attr('transform', transform)
        }
      })

  linkArc(d) {
    const dx = d.target.x - d.source.x
    const dy = d.target.y - d.source.y
    const dr = Math.sqrt(dx * dx + dy * dy)
    return (
      'M' +
      d.source.x +
      ',' +
      d.source.y +
      'A' +
      dr +
      ',' +
      dr +
      ' 0 0,1 ' +
      d.target.x +
      ',' +
      d.target.y
    )
  }
2
3
4
5
6
7
8
9
10
11
12
13
14
15
16
17
18
19
20
21
22
23
24
25
26
27
28
29
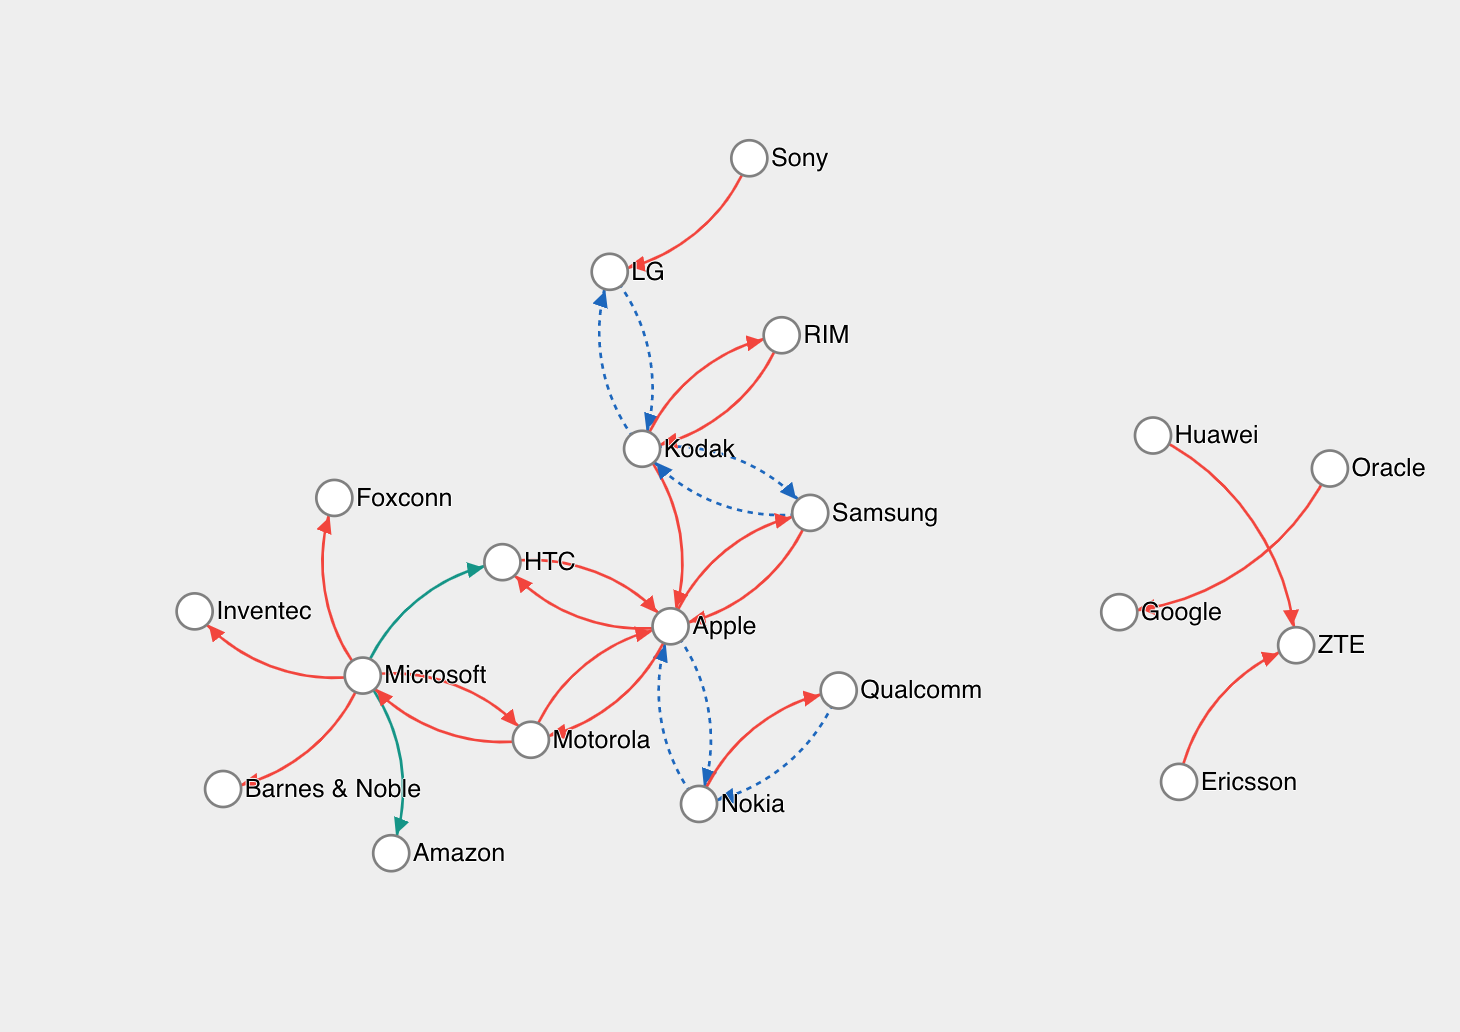
这里我们直接用字符串拼接了一小段 svg 的指令, 效果是画出一条圆弧曲线, 完成上面的代码后, 我们得到的效果是:
# 添加图例
现在我们已经基本完成了预期的效果, 但是图中缺少图例, 访问者会不理解不同颜色的曲线分别代表着什么含义, 所以我们在画面的左上角添加图例.
图例的实现方法大致上面步骤相同, 但是有两个区别:
- 图例是固定在画面左上角的, 坐标可以在代码中直接写死
- 图例比真实数据多一个元素: 描述文字
我们构造一下图例的数据:
const sampleData = [
  {
    source: { name: 'Nokia', x: xIndex, y: yIndex },
    target: { name: 'Qualcomm', x: xIndex + 100, y: yIndex },
    title: 'Still in suit:',
    type: 'suit'
  },
  {
    source: { name: 'Qualcomm', x: xIndex, y: yIndex + 100 },
    target: { name: 'Nokia', x: xIndex + 100, y: yIndex + 100 },
    title: 'Already resolved:',
    type: 'resolved'
  },
  {
    source: { name: 'Microsoft', x: xIndex, y: yIndex + 200 },
    target: { name: 'Amazon', x: xIndex + 100, y: yIndex + 200 },
    title: 'Locensing now:',
    type: 'licensing'
  }
]

const nodes = {}
sampleData.forEach((link, index) => {
  nodes[link.source.name + index] = link.source
  nodes[link.target.name + index] = link.target
})
2
3
4
5
6
7
8
9
10
11
12
13
14
15
16
17
18
19
20
21
22
23
24
25
26
按照同样的步骤, 我们画出图例:
sampleContainer
  .selectAll('path')
  .data(sampleData)
  .enter()
  .append('path')
  .attr('class', d => 'link ' + d.type)
  .attr('marker-end', d => 'url(#' + d.type + ')')
  .attr('d', this.linkArc)

sampleContainer
  .selectAll('circle')
  .data(this.d3.values(nodes))
  .enter()
  .append('circle')
  .attr('r', 10)
  .style('cursor', 'pointer')
  .attr('transform', d => `translate(${d.x}, ${d.y})`)

sampleContainer
  .selectAll('.companyTitle')
  .data(this.d3.values(nodes))
  .enter()
  .append('text')
  .style('text-anchor', 'middle')
  .attr('x', d => d.x)
  .attr('y', d => d.y + 24)
  .text(d => d.name)

sampleContainer
  .selectAll('.title')
  .data(sampleData)
  .enter()
  .append('text')
  .attr('class', 'msg-title')
  .style('text-anchor', 'end')
  .attr('x', d => d.source.x - 30)
  .attr('y', d => d.source.y + 5)
  .text(d => d.title)
2
3
4
5
6
7
8
9
10
11
12
13
14
15
16
17
18
19
20
21
22
23
24
25
26
27
28
29
30
31
32
33
34
35
36
37
38
最终效果:
# 总结
使用 D3.js 进行这样的数据可视化非常简单, 而且非常灵活. 只是在使用 d3-force 时需要多调整一下参数来达到理想的效果, 实际实现的代码并不长, 逻辑代码放在这个文件中: graphGenerator.js, 感兴趣的读者不妨直接看看源码.
# 想继续了解 D3.js
这里是我关于 D3.js 、 数据可视化 博客 的github 地址, 欢迎 start & fork 🎉
# 如果觉得不错的话, 不妨点击下面的链接关注一下 : )
知乎专栏: Data Visualization / 数据可视化
# 想直接联系我 ?
邮箱: ssthouse@163.com
微信:

